Interactive analytics

Your audience is telling you more than you think.

Traditional analytics tell you what people watched. Adventr reveals what they did, what they chose, and what drove them to act—across every channel where your content lives.

Interactive funnel

Two sides of the story. One complete picture.

Understand what happens inside your content—and how it performs across every channel.
Content & audience analytics

Know what your audience does.

Views & plays
Content loads, starts and viewing activity.
Watch time & completion
Viewing duration and completion rates.
Interaction rates
How frequently audiences participate.
Audience choices
Selections, answers and decisions made by click, voice or other inputs.
Decision paths
Branches and journeys audiences follow.
Drop-off points
Where viewers disengage or abandon an experience.
Conversions
Click-throughs and desired actions.
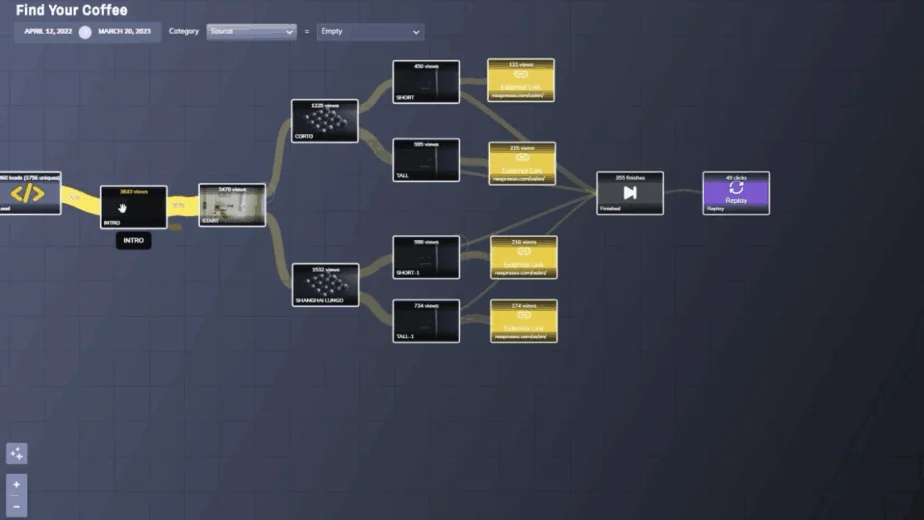
Content choices and performance in the Adventr funnels dashboard
Adventr Funnels Dashboard
Distribution analytics

Know where your results come from.

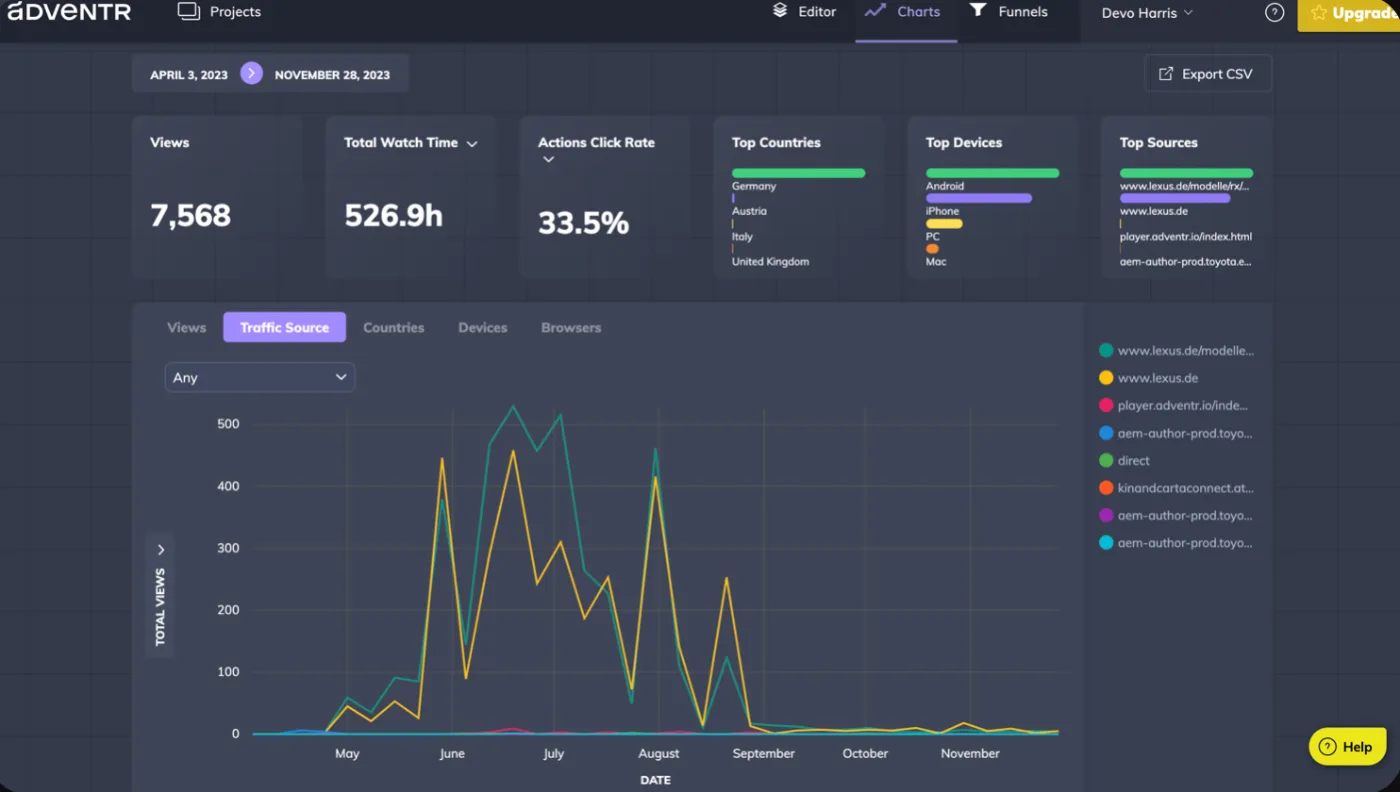
Traffic sources
Websites, referrals and campaigns.
Campaign tracking
UTM parameters and campaign performance.
Device performance
Engagement across desktop, mobile and connected TV.
Geographic analytics
Audience location and geographic performance.
Channel comparisons
Engagement and completion by traffic source.
Conversion tracking
Actions generated across distribution channels.
Traffic source chart in the Adventr charts dashboard
Adventr Charts Dashboard

Powerful analytics. Ready to use.

Flexible filtering
Filter by date, device, location and traffic source.
Real-time reporting
See audience activity as it happens.
CSV exports
Download charts data for reporting and analysis.
Real-time API →
Access Adventr analytics in your own applications and systems.

Analytics that passive media can't deliver.

When audiences participate, every decision becomes measurable. Discover preferences, behaviors and patterns traditional video can't reveal.

Audience choices

Know what audiences choose.

Track answers, selections and preferences across interactive experiences.

“Which one is for you?”
3 options
Trail runner46%
Road racer33%
Cross-trainer21%
Selections made by click, tap or voice · Sample data
Audience journeys

See how they navigate.

Understand which paths viewers take, where they branch and where they leave.

Decision branches and drop-off in the Adventr funnel
Adventr Funnels Dashboard
Outcomes

Discover what drives action.

Understand how audience decisions and participation relate to conversions and other outcomes.

Choice
Selected
Clicked “Shop now”
Trail runner
4,812
18.4%
Road racer
3,451
11.2%
Cross-trainer
2,197
7.9%
Aggregated CTA engagement by choice · Sample data

See what's working. Make it work better.

Your analytics and creation tools live together. Identify where audiences disengage, refine your experience and update your published content.

Drop-off points in the Adventr funnels dashboard
01Identify

Find opportunities.

Spot drop-off, engagement patterns and underperforming interactions.
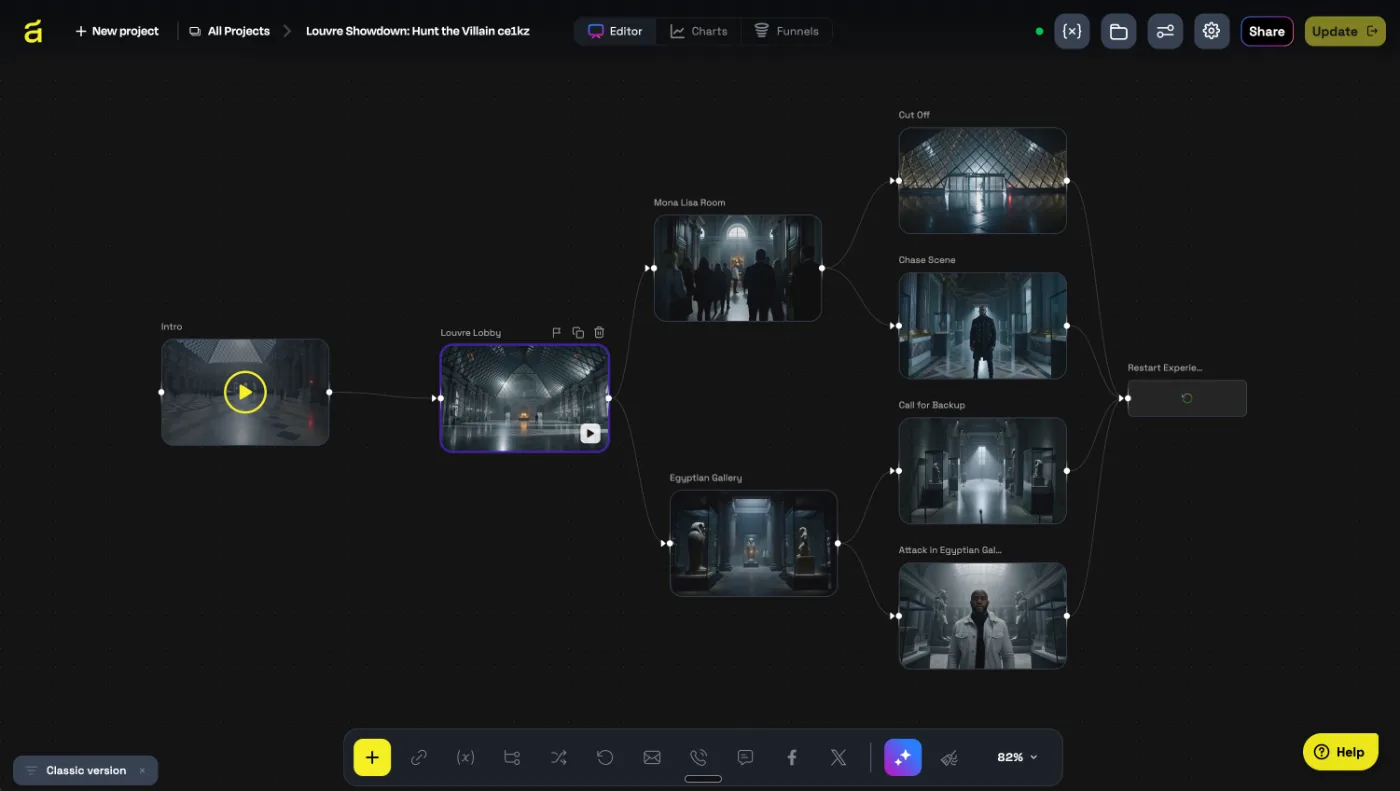
The Adventr editor
02Improve

Make changes.

Return to the Adventr editor and refine the experience based on what audiences do.

Performance over time in the Adventr charts dashboard
03Measure

Track the results.

Measure performance after updating the published experience.

Turn every interaction into insight.

Create experiences that engage your audience—and reveal what matters to them.